Yes, it’s more about the Republican health care plan. If you were wondering what was going on with “repeal and replace” lately, wonder no more, for I, the nation’s foremost purveyor of comics on wonky healthcare subjects, am on the case!
Published on September 6, 2017. See the end for citations. And see this article about Trump’s most recent sabotage move (as of September 13),
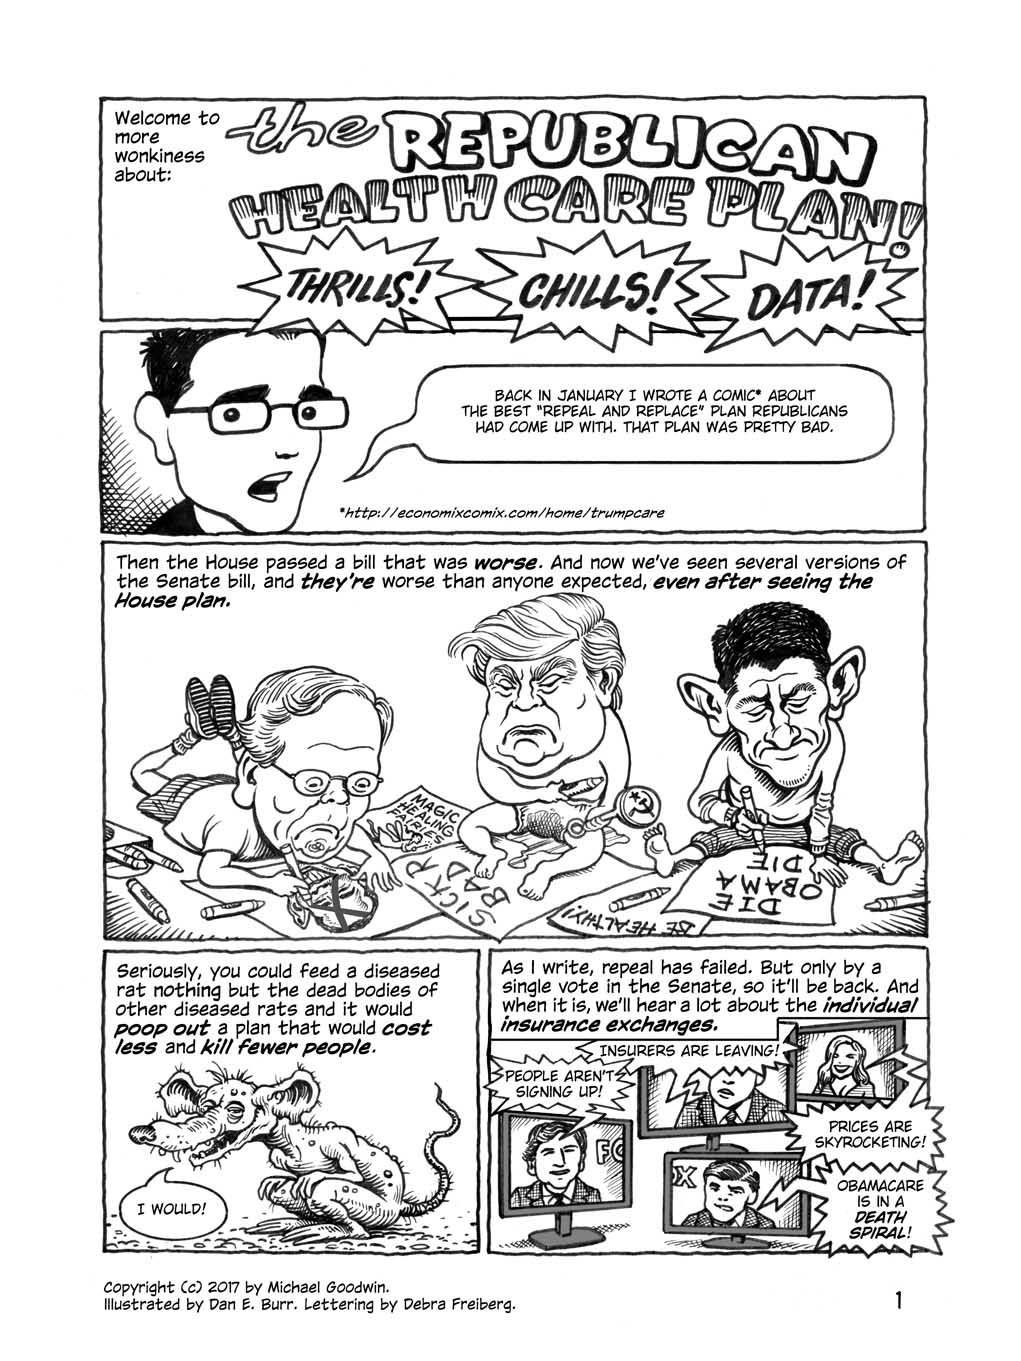
Here’s the earlier piece I mention, in easily clickable form: https://economixcomix.com/home/Trumpcare.
And check out some of my other comics, explaining:
Social Security (2012)
Net Neutrality (2014)
The Trans-Pacific Partnership (2014)
Obamacare (2014) and a follow-up in 2015. You can probably skip the follow-up.
I also have a book giving the entire history of the economy! There’s a free preview (the Adam Smith section) here.
And as promised, my sources:
Page 1 Panel 3: The Senate bill isn’t necessarily worse in itself, but everyone expected it to be an improvement on the House bill, which it was not.
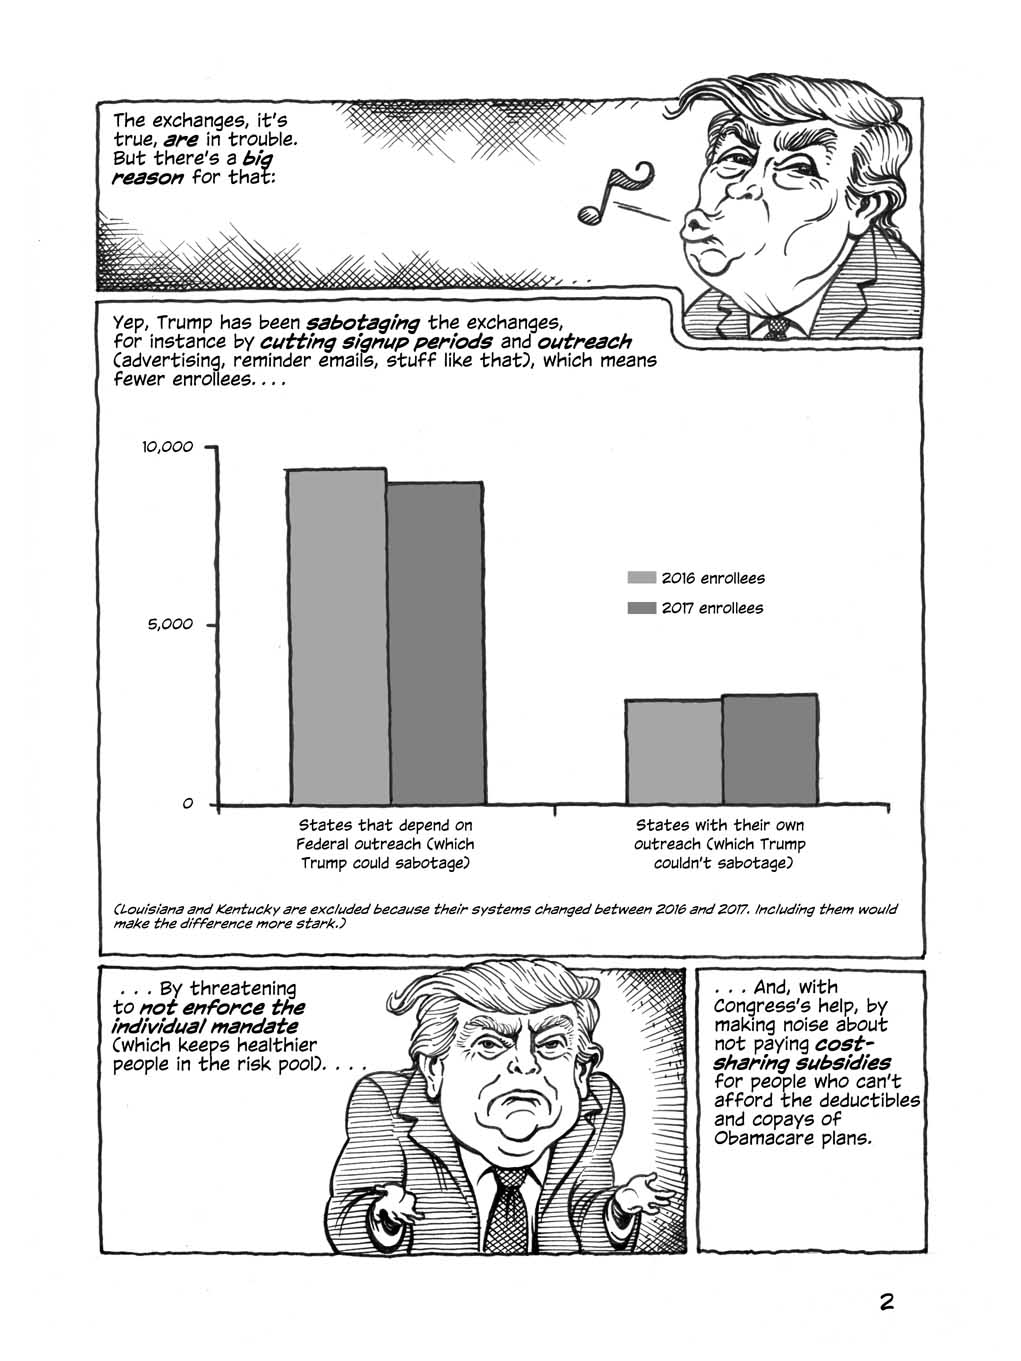
Page 2 Panel 2: http://acasignups.net/17/03/16/updated-want-evidence-trump-killing-hcgov-ads-hurt-enrollment-check-out; http://acasignups.net/17/03/16/huh-imagine
Page 3 Panel 1: https://www.vox.com/2017/5/8/15563448/trump-insurance-premiums-2018.
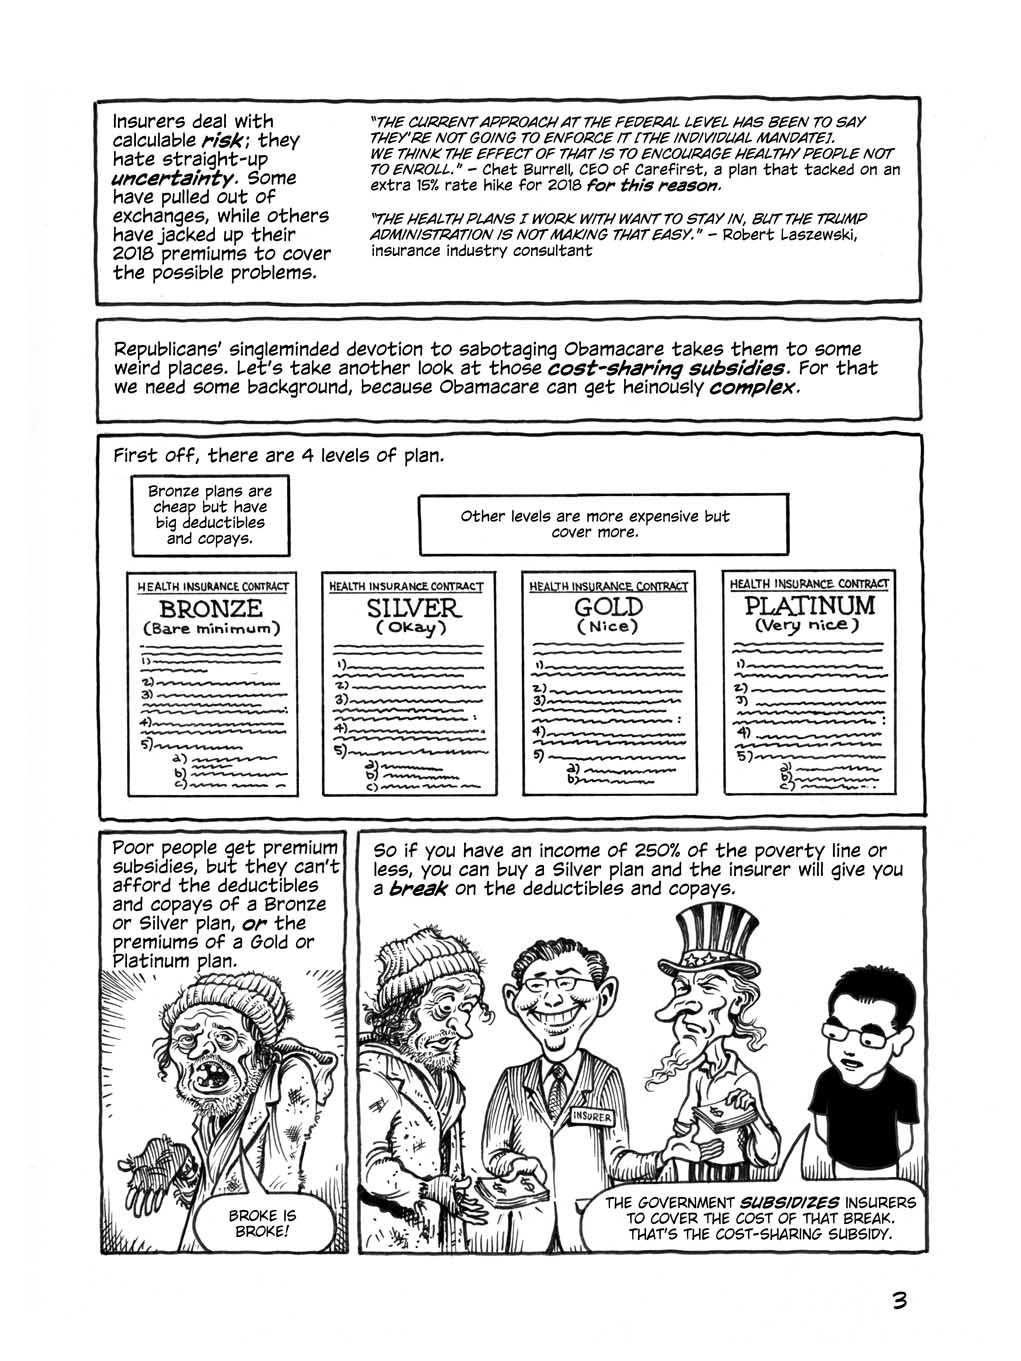
Page 3 Panel 3: Specifically, Bronze plans cover 60% of an enrollee’s expected health care costs, Silver plans cover 70%, Gold plans cover 80%, and Platinum ones cover 90%.
Page 3 Panel 5: For the fact of the cost-sharing reduction, see here. For the government payments, see here.
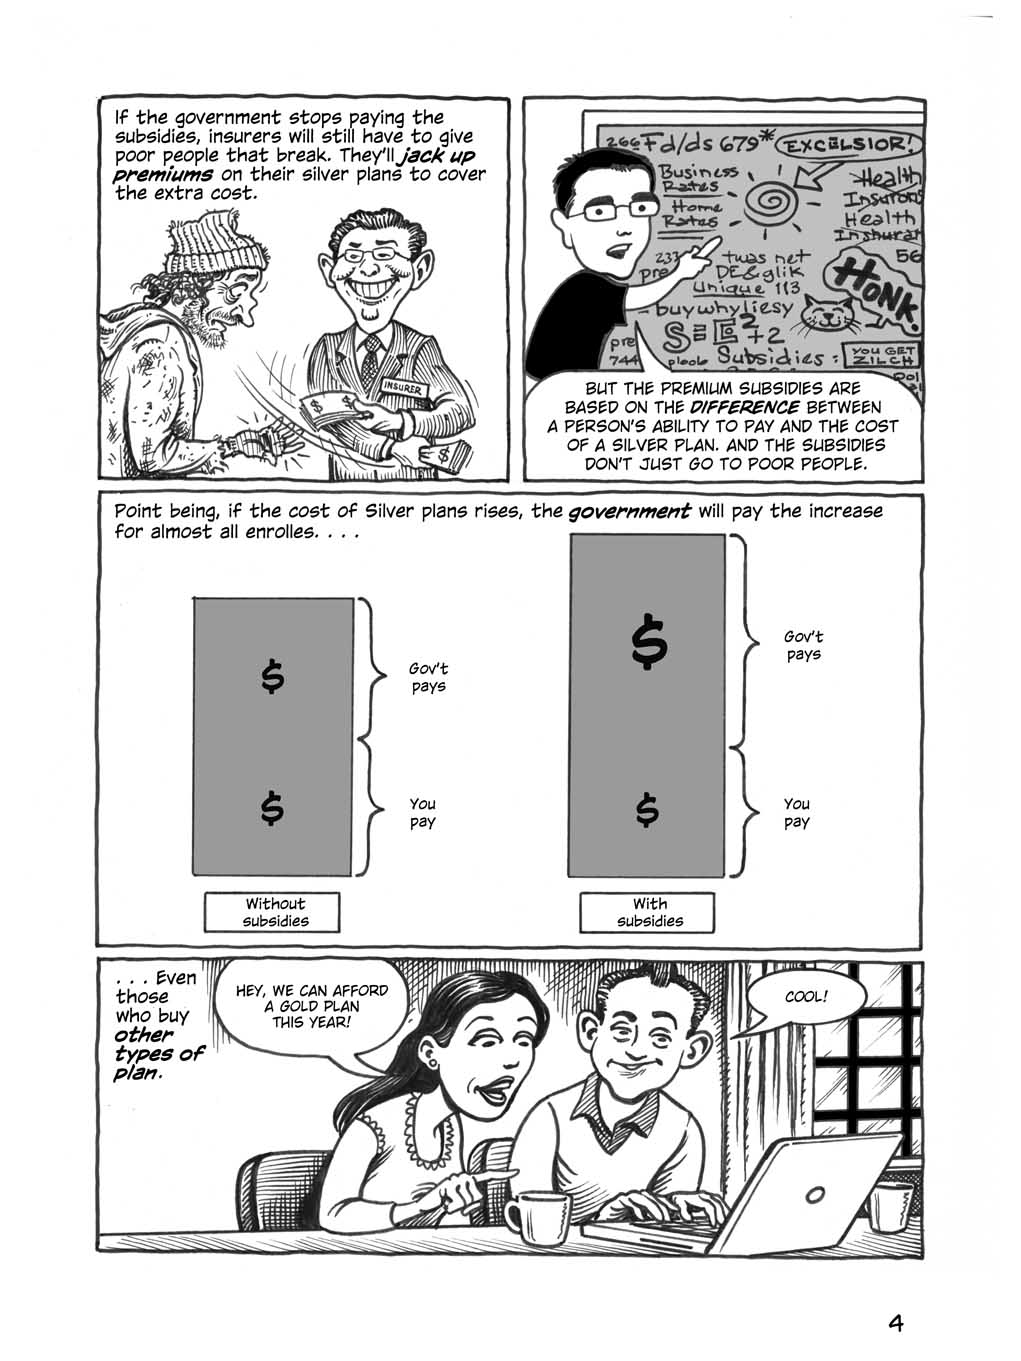
Page 4: The whole story is covered pretty well here.
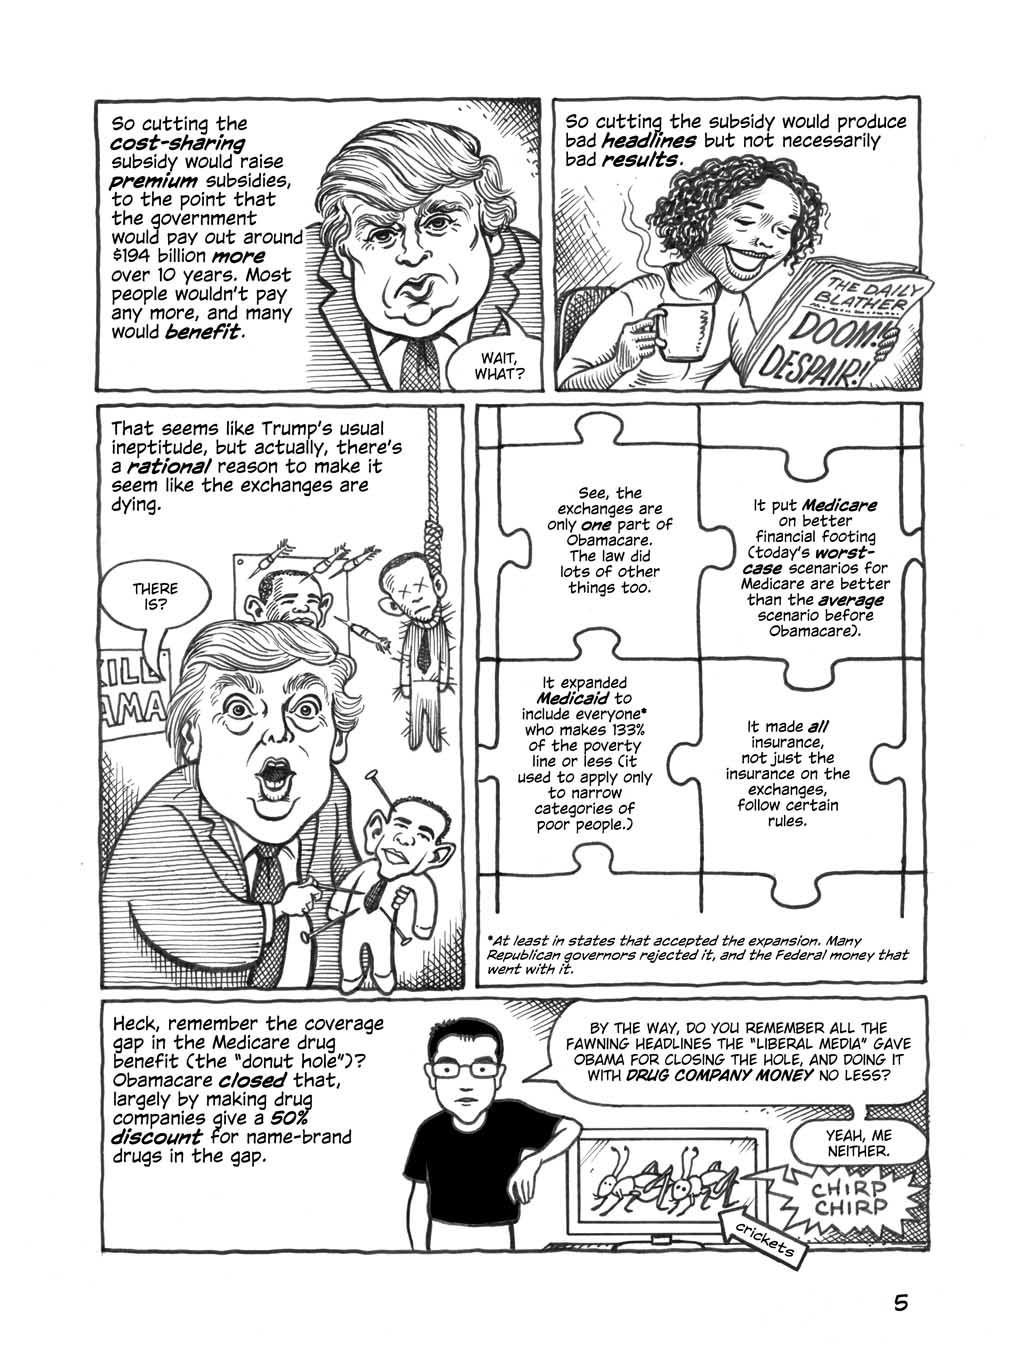
Page 5 Panel 1: $194 billion is quoted here.
Page 5 Panel 4: Worst-case scenarios better than average pre-Obamacare scenario: In the 2009 Medicare Trustees’ Report, Figure II.D.1, Medicare expenditures were expected to reach 11% of GDP by the 2080s. In the 2015 report, Figure I.1, the worst-case possibility was 9% of GDP by the 2090s. The improving economic outlook played a part in this, but so did Obamacare’s restraint of Medicare costs (for which, see here.)
Page 5 Panel 6: See https://www.medicare.gov/Pubs/pdf/11493.pdf.
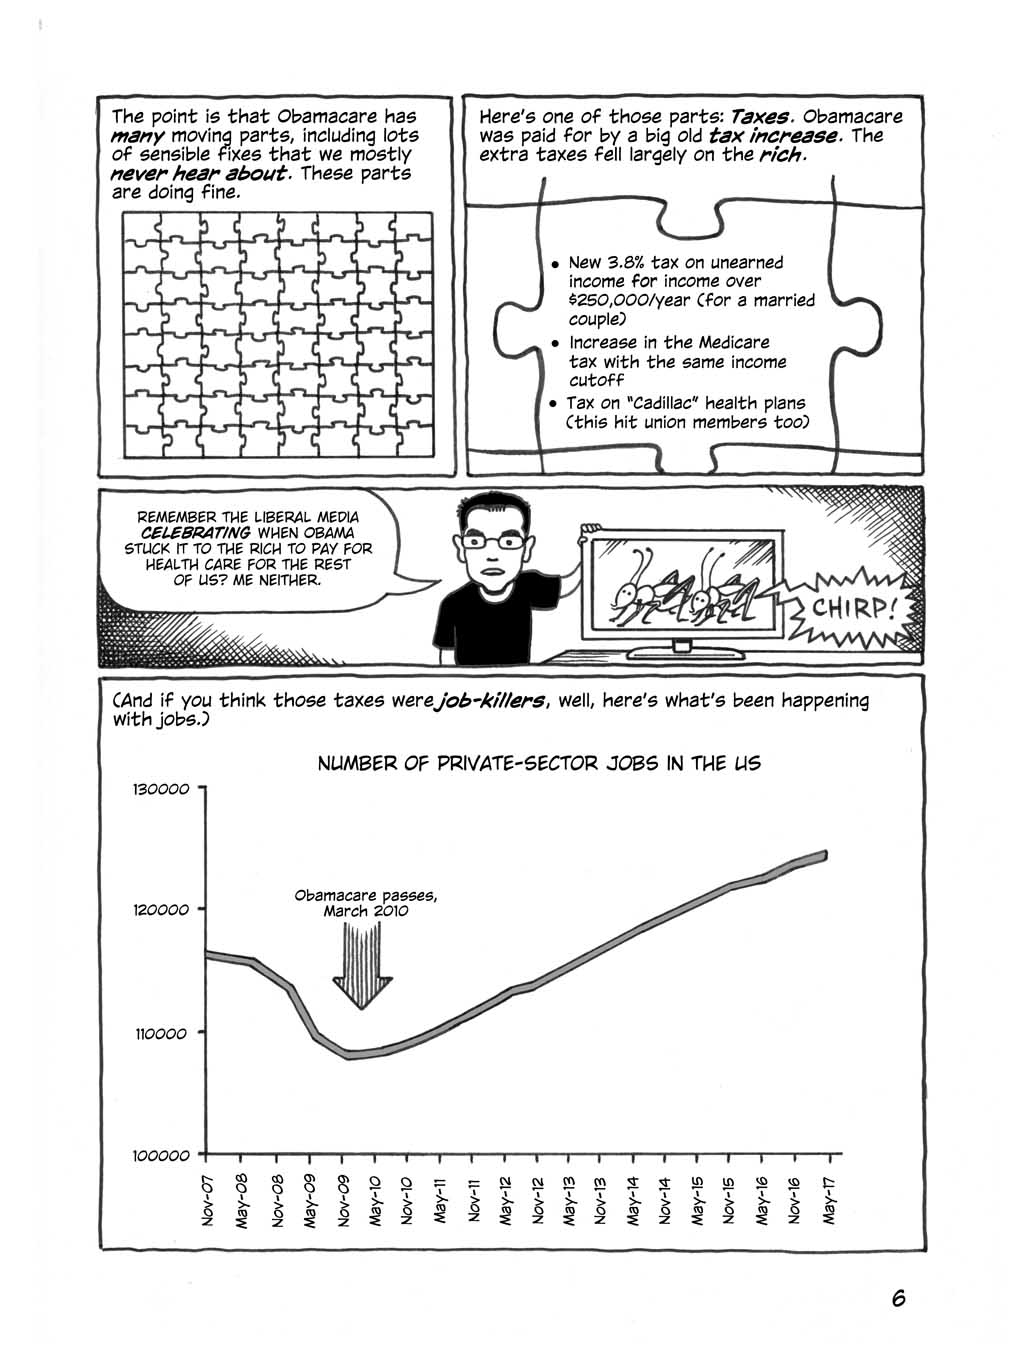
Page 6 Panel 2: The tax increases are listed on the website of Representative Jeff Duncan (who’s no friend to them but lists them accurately).
Page 6 Panel 4: The employment data are given here.
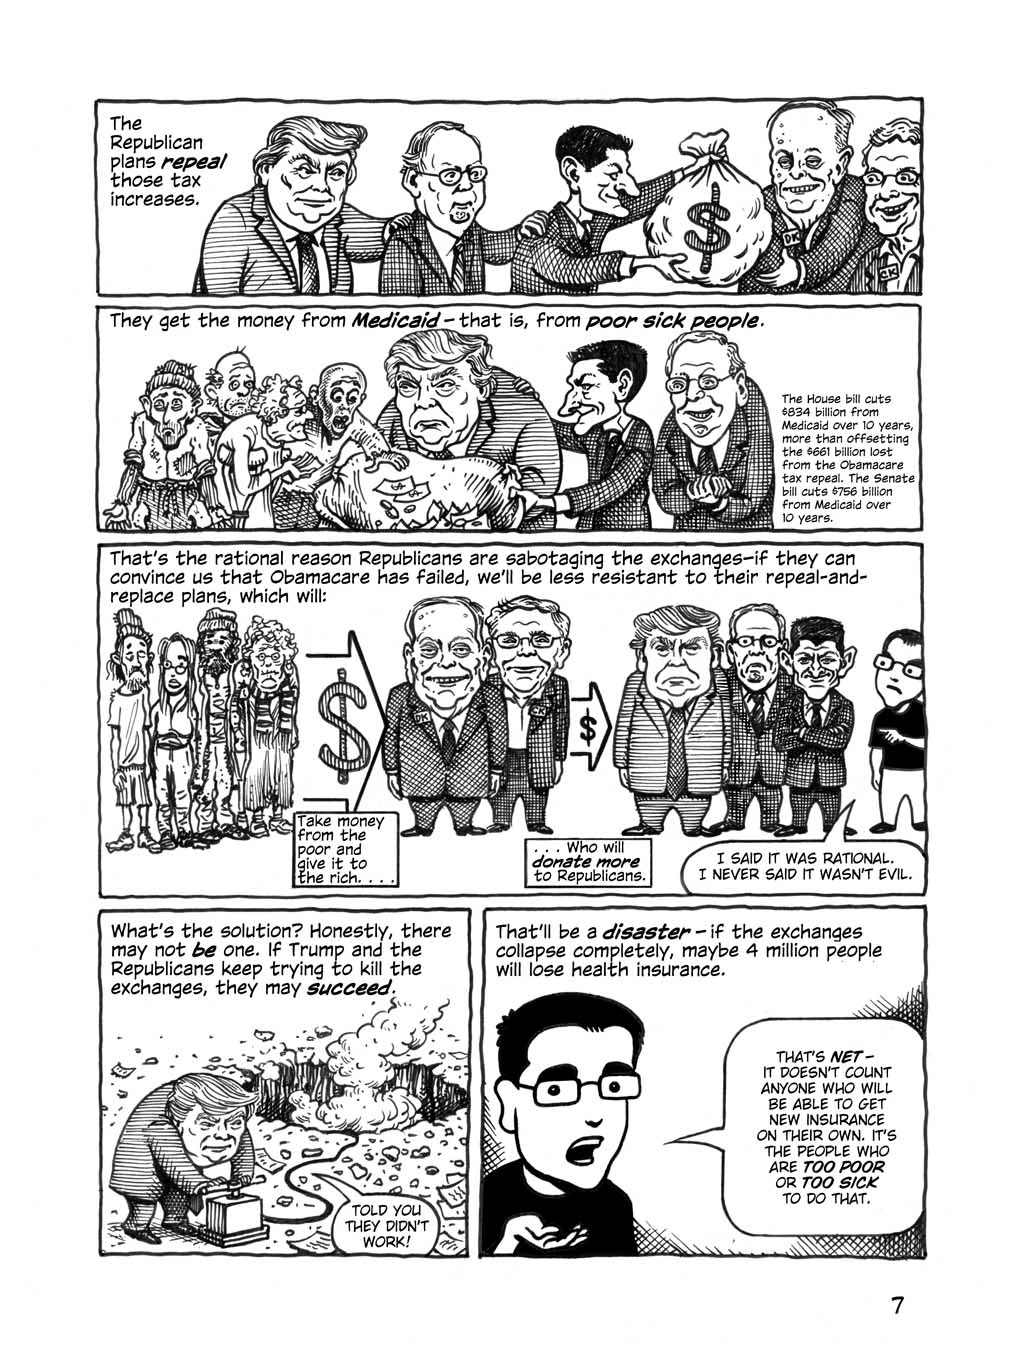
Page 7 panel 2: The House bill: See https://www.cbo.gov/system/files/115th-congress-2017-2018/costestimate/hr1628aspassed.pdf. The Senate bill: See https://www.cbo.gov/system/files/115th-congress-2017-2018/costestimate/52941-hr1628bcra.pdf.
Page 7 last panel: 4 million is conservative; the Rand Corporation estimated that 4.1 million people on the exchanges as of 2015 hadn’t had health insurance before, and presumably would lose it if the exchanges went away, but the number of people on the exchanges has grown somewhat since then. The CBO estimated up to 10 million people would lose individual coverage, including those on the exchanges, but doesn’t specify the number for the exchanges specifically. (https://www.cbo.gov/system/files/115th-congress-2017-2018/costestimate/hr1628.pdf).
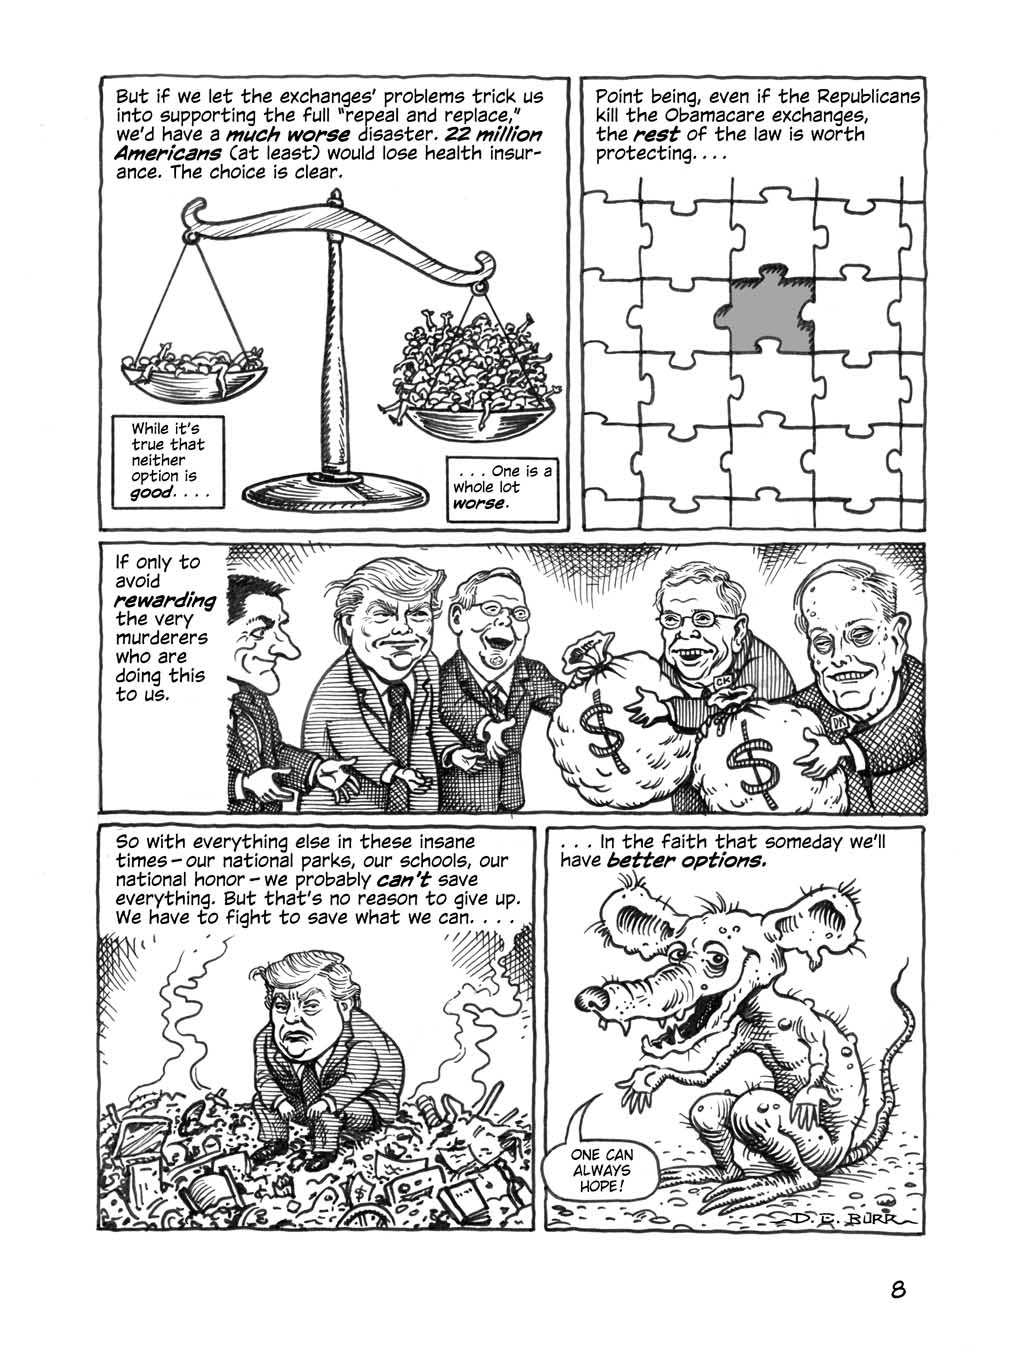
Page 8 Panel 1: 22 million: It’s 23 million for the House bill and 22 million for the Senate bill. And yes, that means dead people. I couldn’t give the specific number of deaths because the estimates vary so widely (see http://www.latimes.com/business/hiltzik/la-fi-hiltzik-repeal-deaths-20170623-htmlstory.html). But the proportions are basically right.